
For those who are running bandchain validators, we have added some custom prometheus metrics to the report executor, yoda. Although some metrics can be tracked on-chain, this exporter allows validators to get data in real-time directly from the yoda process, and easily plug into their existing monitoring/alerting systems.
The metrics added are:
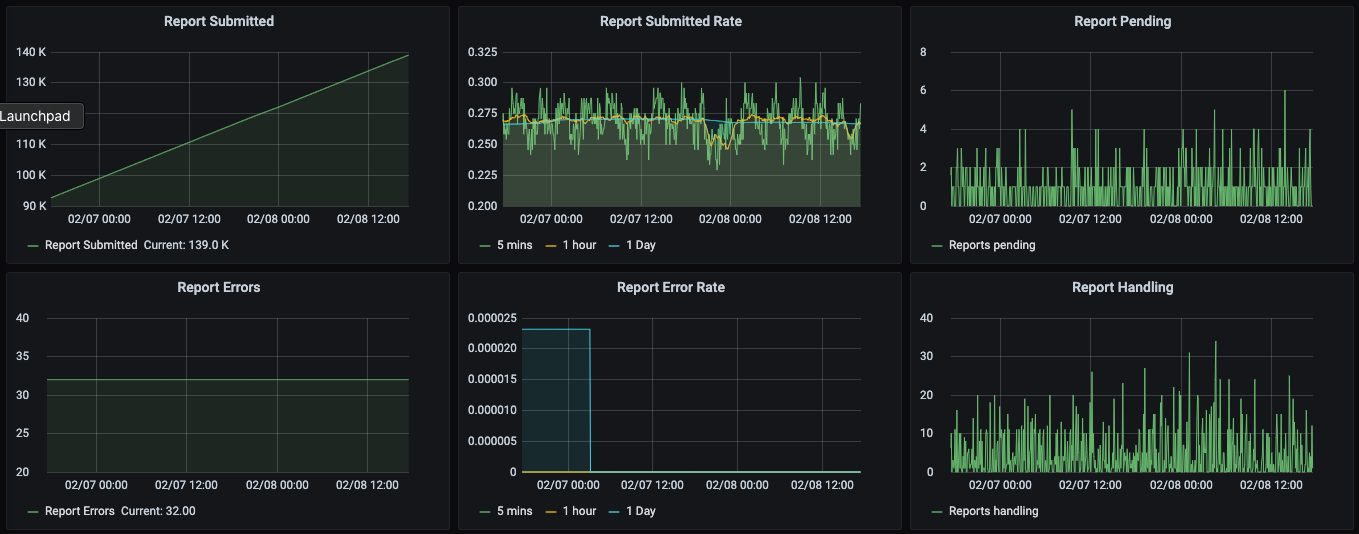
1) yoda_reports_error_total - total number of errors logged.
2) yoda_reports_handling_count - number of reports currently being executed.
3) yoda_reports_pending_count - number of executed reports that are pending submission to the chain.
4) yoda_reports_submitted_total - total number of reports submitted to the chain.
To enable the exporter, simply add a line to your yoda config file specifying the address and port to listen on, for example:
metrics-listen-addr: "127.0.0.1:26662"
We are using the expression below for alerting, to allow for an occasional error but alert if there are many errors or an unusually high number of reports:
yoda_reports_handling_count > 50 or yoda_reports_pending_count > 10 or rate(yoda_reports_submitted_total[10m]) == 0 or rate(yoda_reports_error_total[5m]) > 0.05
This exporter is planned for release with version v1.2.8 of bandchain protocol. Many thanks to Bun and the Band team for feedback and support!